


How to measure deviations?
Measures of Dispersion #DS3

Imagine you’re one of the top guys at Substack like
, or let’s just assume that you’re the owner of your newsletter and you’re interested to know the average number of subscribers you’ve gained in the past 5 weeks, what would you do?You’d add up all the subscribers and divide the number of weeks inorder to come up with the average, right?
Now what if you want to know about the ‘ups-and-downs’ in the subscriber count for the past 5 weeks? Which week has or hasn’t met your expectations? How would you find this info out?
I’m sure you’d want to know the reason behind the rise and fall of number of subscriptions added but ‘average’ would certainly not be the number to depict the rise and fall.
Averages are only used to convert the ‘bumps in a line’ into a flat line. Perhaps, if you were questioned about summarizing your growth, you’d just quote the average.
This has been explained in the graph below —
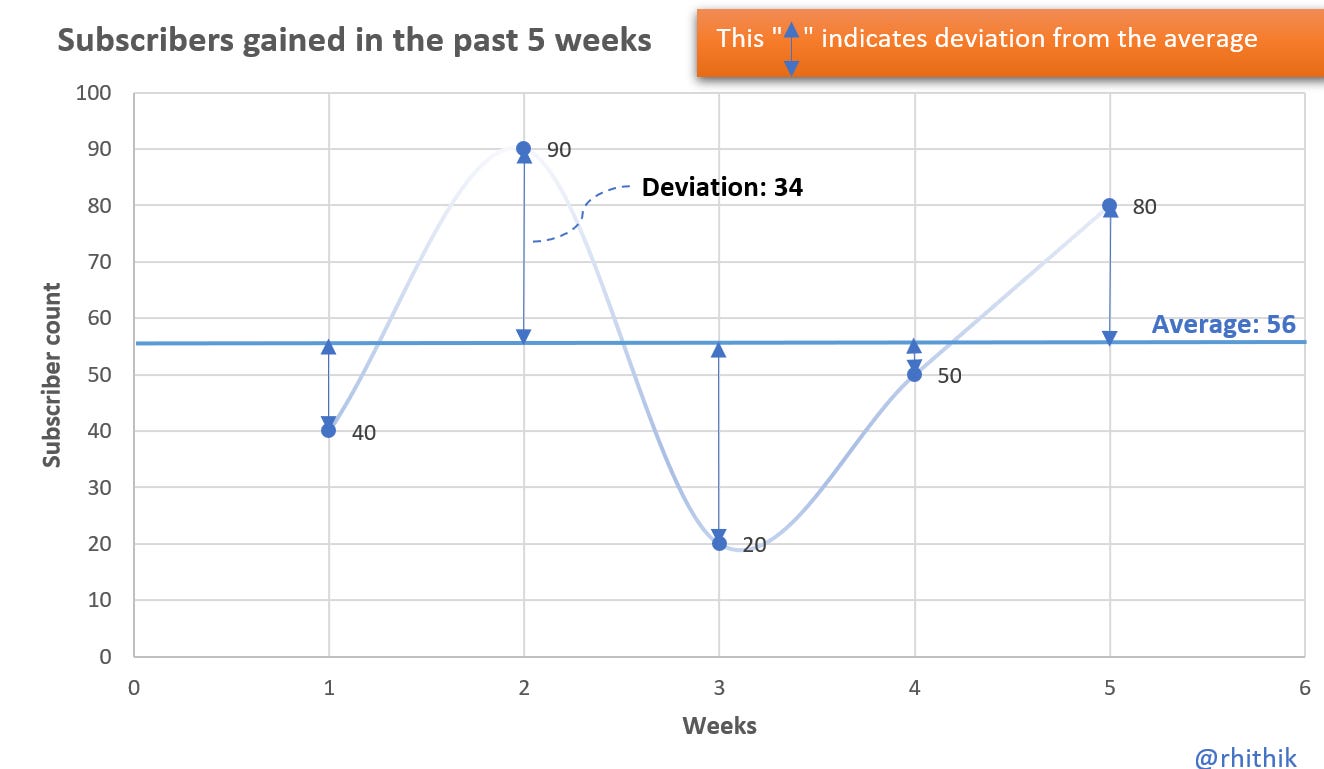
But as the decision maker of any business — no matter how small or big, you need to use the data on what is, what could be and the gap in-between the two to make an effective decision. These ‘gaps in-between’ to be filled are called deviations.
What do I mean by deviations?
Deviations or dispersions describe the scatteredness of your data. It says how dispersed or far away the individual items are from the central value of the data. If you were only given the average and the deviation value, you could reconstruct the whole data! That’s how important deviations are.
“Dispersion is the measure of extent to which the individual items vary.”
— L.R. Connor
How do you measure them?
In terms of distance between the values of selected observations, called the distance measures like — Range and Quartile Deviation.
In terms of average of deviations of observations from some central value, called — Mean Deviation and Standard Deviation
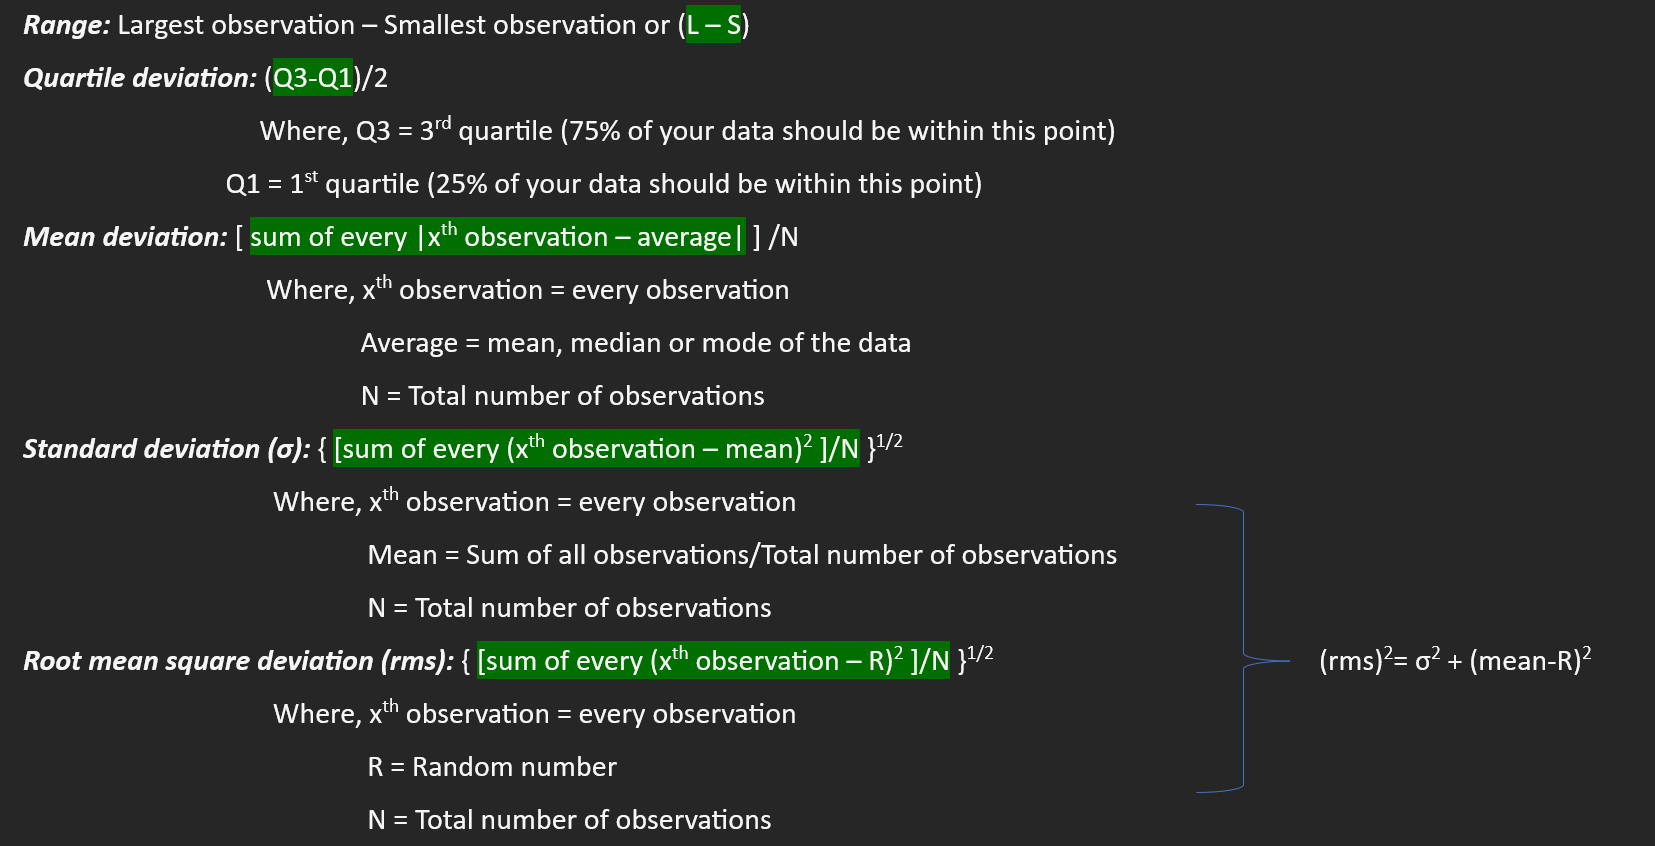
1. Range
It is the difference between the extreme values - the largest and smallest, of the dataset. But this form of measure is unreliable since the extreme values are subject to fluctuations in the form of outliers1.
2. Quartile Deviation
It is an upgrade over range, as it uses 50% of the data to come up with a measure of deviation. It’s the average of difference between the first and third quartiles of the dataset. But this measure is unreliable as it ignores the rest of 50% of the data.
3. Mean Deviation
As the name suggests, it’s the arithmetic mean of absolute2 deviations between the observations and the average (which can be either mean, median, or mode).
It is better than range and quartile deviation but since we ignore the signs of deviations by simply converting them all to positive, makes this type of deviation vulnerable and unreliable. It’s also called as Mean Absolute Deviation (MAD).
4. Standard Deviation
It is the positive square root of the arithmetic mean of the squares of the deviations of observations from their mean.
It’s denoted by “ σ ” and squaring the standard deviation “ σ^2 ” gives variance.
Too many damn ‘ofs’, right?
Follow the steps below —
Find the deviation between each observation and the mean of the data.
Square3 each of these deviations and add them all up.
Divide the value obtained in step 2 by the total number of observations in the data.
Take a positive square root of this number obtained in step 3.
And there you go, it’s the standard deviation!
Now, what if in step 1, I find the deviation between each observation from a random number “R” instead of the mean?
Then I would again follow the same steps, except now my measure will be called Root Mean Square Deviation. Denoted by “rms”
Continuing with our example —
Remember the 'subscriber growth count' example we discussed earlier?

Its dataset is {40,20,50,90,80} which can be rearranged as {20,40,50,80,90}.

Mean: 56
Median: 50
Q1/1st quartile: 30
Q3/3rd quartile: 85

1. Range: 90 - 20 --> 70

2. Quartile Deviation: (85 - 30)/2 = 55/2 --> 27.5

3. Mean Deviation: [ |20-56| + |40-56| + |50-56| + |80-56| + |90-56| ]/5
                 --> [ |-36| + |-16| + |-6| + |24| + |34| ]/5
                 --> [36+16+6+24+34]/5
                 --> 23.2

4. Standard Deviation:

--> {[ (20-56)^2 + (40-56)^2 + (50-56)^2 + (80-56)^2 + (90-56)^2 ]/5} ^ (1/2)
--> {[ (-36)^2 + (-16)^2 + (-6)^2 + (24)^2 + (34)^2 ]/5} ^ (1/2)
--> {[ 1296 + 256 + 36 + 576 + 1156]/5} ^ (1/2)
--> {[3320/5]} ^ (1/2)
--> {664} ^ (1/2)
--> 25.76
Conclusion
We can conclude that the subscribers for the past 5 weeks have been deviating on a standard basis by 25.76 ~ 26 people.
(Because people can’t be expressed as decimals!)
How to interpret the meaning of ‘26 people’?
So, after every week, on average, the ‘subscriber growth’ count was close to 26 people away from the average growth of 56 subscribers.

But now that I think of it, I have more doubts now than ever before. Some being-
What is the difference between mean deviation and standard deviation?
Why do we square standard deviation? Why not cube them or go for higher powers?
What if I want to compare the deviations of subscriber count of the first 5 weeks of the year and the last 5 weeks of the year? How would I do that?
How am I going to use deviations as a measure of comparison between two completely unrelated data like — the test scores of a subject and the subscriber count of my newsletter, over the past 5 weeks?
Dear Reader, to answer these mindboggling questions, you'll have to stay with me on this journey just a bit longer. Until then,
Thanks for reading!
Subscribe to ‘The Statistician’ and don’t forget to share!
Outliers are data points that differ significantly from other observations in a dataset. They can be unusually high or low compared to the rest of the data and can distort statistical analyses, leading to misleading results.
The notation ∣x∣ represents the absolute value of x. The absolute value of a number is its distance from zero on the number line, regardless of direction. Therefore, the absolute value is always non-negative.
Examples
∣3∣ → 3
∣−3∣ → −(−3) → 3
∣0∣ → 0
It’s basically the conversion of negative sign into positive holding the same value.
The notation x^2 means x multiplied by itself.
Examples
3^2 → 3 x 3 → 9
(-3) ^2 → -3 x -3 → 9