

Elucidation of Descriptive Statistics
Or how do you describe data? #DS1

Have you ever wondered about the decisions you took in the past? Would you do it any differently if you were ever given a chance to travel back in time? Would you like to replace your poor decisions with better ones?
Now let’s get out of these questions because it just doesn’t make sense to think about something which isn’t possible. While it’s a common human experience to reflect on past decisions, we are all required to move on and expected to be more proactive with our decision-making skills. We are required to act mature and analyze the pros - cons of every aspect pertaining to the decision being made. But I just go ahead with my gut-feeling if I were being completely honest with you.
Analyzing every situation in detail before acting does not seem practical or efficient, especially when it pertains to daily matters. But what do we do when we run a business or maybe we are concerned with something more complex than our daily conundrums? Well, there’s nothing more sensible than to analyze the past data regarding our problem, then proceeding to solve and summarize our possibilities to act in the most effective way.
Now how do you summarize your data? How do you decide the 3Ws (What, When, Why) for the measures to be used? What is the type of data that you’re dealing with? How do you know the best measure to be considered?

To address these complex issues, Statistics is categorized into Descriptive and Inferential Statistics.
Descriptive Statistics - The primary aim of descriptive statistics is to summarize and describe the features of a dataset. They are used to provide a snapshot of the data, showing patterns, trends, and anomalies.
Inferential Statistics - The primary aim of inferential statistics is to make inferences and predictions about a population based on a sample of data taken from that population. They rely on probability theory, Sampling Theory, educated guess and Error predictions to draw conclusions about the population.
Although it may appear overly formal, I assure you it's quite straightforward. Descriptive statistics are primarily focused on summarizing current and historical data, whereas inferential statistics (derived from 'to infer') are used to make predictions about the future based on existing data.
In my previous post, I explained about the origin of statistics as a subject (TLDR - Statistics evolved from a counting mechanism —> placing trends —> probability mixed with statistics —> mathematical statistics which is modern statistics used to infer from data). Let me start with the descriptive aspect of statistics. I intend to explain every concept out there (I’ll try my best), so bear with me!
But before jumping to any of the main concepts, lets know the basics — what is data? what is information? Well, data is something raw, unorganized and scattered form of points or values whereas an information is something more processed, ordered, and meaningful form of data. Information is born out of data. What are the types of data though? Sure, let’s look into it!

TYPES OF DATA
There are obviously many ways to process data but before doing that, it is quite important to know the type of data that we’re dealing with. There are different approaches out there to deal with different types of data.
Data is either quantitative (numbers or numerical) or qualitative (attributes or categorical) in nature. They are further classified as shown below -

QUALITATIVE DATA
When the data depicts the attributes based on a parameter (variable), it categorizes the attributes or ‘qualities’ of such parameter and hence is grouped together, only to be called as qualitative or categorical data.
Under this, it is further classified as -
Nominal Data - Imagine if I asked you to choose the best religion (Hindu, Jain, Sikh, Christain, Muslim, etc.) or race (White, Black, Asian, etc.) or blood group (A, B, AB, O, etc.) out there, which one would you choose? OfCourse, I don’t mean to stir anything up but in general, there is no best religion or race or blood group out there which is applicable to all because everyone has a preference of their own. You cannot call male or female as the best gender! In short, there is no natural order or rank available. Hence, when we cannot rank or order such data, it is called a nominal data.
Ordinal Data - But what if there exists a natural response, in sense of order or rank for a data? Then, there exists some sort of preference or hierarchy among the data. This is usually decided by comparison of some characteristics of such data, then proceeding to rank or order them accordingly. For instance, if I ask you to rank the job roles in an organization, you wouldn’t tell me that it isn’t possible, but you also wouldn’t be dumb enough to tell me that the CEO of a company is a smaller role when compared to a mere middle level manager of the same company, right? well, it’s simply hierarchy that comes into play. So, the right order would be Junior employee, Senior Employee, Supervisor, Manager, General Manager, CEO! (I’ve simplified the chain of roles). So, when the data can be ordered or ranked, then it’s called an ordinal data.
QUANTITATIVE DATA
Now what if I the data was in the form of numbers or some sort of ratings (which is again numbers!), how would you classify that? how do you summarize such data?
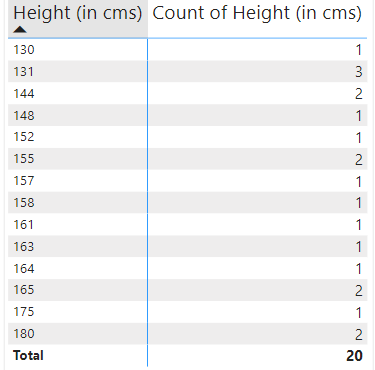
Let me give you an example, what if we measured the height of 20 people randomly, and the result came out as follows -
Height (in CMs): {144, 131, 165, 130, 131, 158, 180, 175, 165, 161, 155, 152, 164, 163, 131, 148, 157, 180, 144, 155}

note: CMs - centimeters
I could write this above data in two different scales, one being discrete (ratio) and another being continuous (interval). One might ask “how?” Well, the origin of statistics started quite literally with the concept of counting1.
So, with our example, we can either count the data individually or increase the count of the data point every time they occur (the frequency distribution2), as shown below —
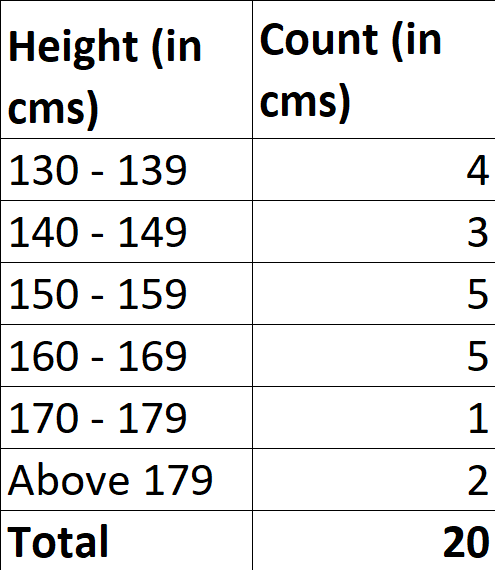
Or there might be a scenario where it is not possible to count the height data exactly, but it can be assessed to lie in a certain interval of heights. Then, every time you ascertain someone to be of height anywhere between say, 130 to 139 CMs, you simply increase the count of the interval ‘130 - 139’ by 1. Now don’t worry if you don’t get it! The given data should look something like this after grouping it into intervals of equal length3 (say 10 CMs) -
Discrete Data - This type of ungrouped data can be easily countable and it quite precise in nature. A good example would be the height, weight, etc.
Continuous Data - This type of grouped data cannot be counted but is measurable in nature. Hence, it is added to the respective intervals. A good example would be measuring the temperature, range of salary, etc.
This probably concludes the types of data available in statistics. But now, I have a question though. What do I do with this table? What am I supposed to learn from this data? How do I summarize this information? Is it possible to come up with a single value that represents the whole data? If so, how do I measure it?
To find answers to all these questions, dear reader, you’ll have to stick around longer to know more! Until then,
“In times of change, learners inherit the earth.” - Erich Fromm
The concept of ‘tally’ was used to count the data points. A bar (I) called a tally mark is put against the data point when it occurs. Having occurred four times, the fifth occurrence of the data point is represented by putting a cross tally (/) across the first four tallies. This made the calculation easier and would later be used as a pictorial representation of a histogram in a certain way. It is shown below -

A frequency distribution is a summary of how often different values or ranges of values occur in a dataset. It is typically presented in the form of a table, chart, or graph, showing the frequency (count) of each distinct value or interval of values. Frequency distributions help to understand the underlying patterns, trends, and variability within the data.
It is not necessary that the length or width of the interval be equal. They can be unequal too! Here, the width of interval is 10 CMs, meaning there are 10 points in the interval 130 to 139 CMs.
Hey Rhithik, thank you for posting this piece! I minored in economics in college and I've taken some stats classes and surprisingly, those ended up being my favorite classes lol. I always thought I would struggle because I wasn't the best at math, but I learned way more about data and ways to calculate, code, etc, from that class that are super valuable skills that even writers like me need to learn, especially when it comes to running a business and trying to cater to our audience. Keep up the great work! :)